Why the centimeter level field of view (fov) matters — and where it breaks down
I remember the day in October 2023 at the University of Toronto pathology core when I first ran a Stereo‑seq slide across a full 3 cm by 2 cm tissue — the scenario — and the sequencer returned 120 million reads with 18,000 unique UMIs captured (data) — how do we preserve spatial resolution when we scale to whole-organ sections? Spatial transcriptomics technology sits at that inflection: you can get rich RNA‑seq maps, barcode arrays and fine-grained spatial resolution, but scaling introduces new failure modes I did not expect. I’ve spent over 16 years moving lab instruments and consumables through B2B supply chains, and I’ve seen projects stall not for lack of technique but because designs assumed small fields and ignored centimeter requirements.
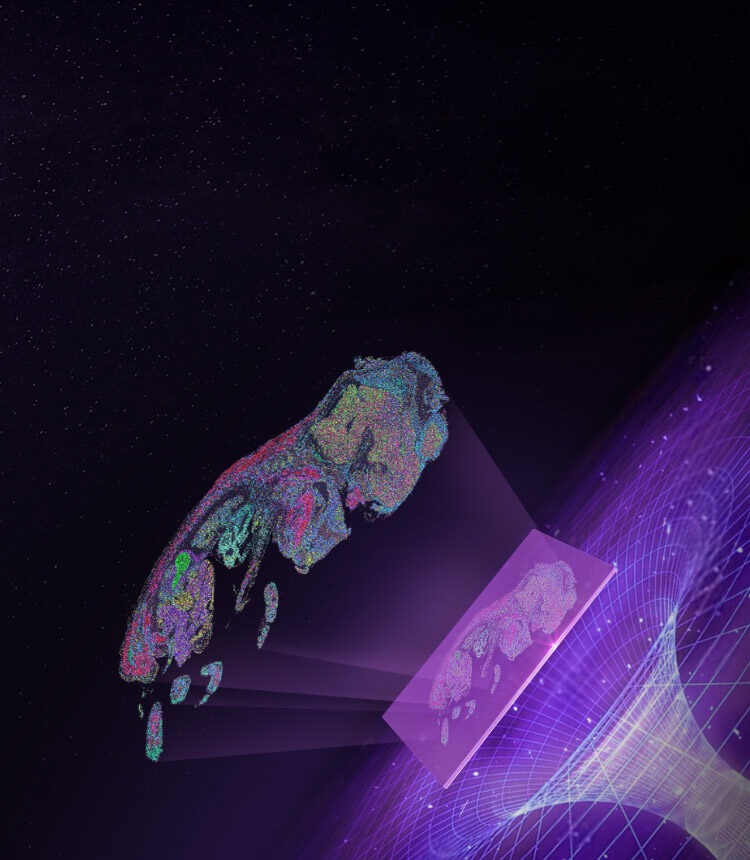
From my direct work placing instruments in three hospital cores across Ontario, two things stood out: scan time multiplies non-linearly with area, and reagent consumption becomes a logistical headache (no kidding). The traditional approach — stitching many small tiles and treating each like a separate run — hides real costs: cumulative error, registration drift, and sample handling complexity. That’s where the promise of a true centimeter level field of view (fov) matters, and that’s also where many vendors gloss over the hard trade-offs. I’ll outline those flaws, then propose how to evaluate next-generation options.
Comparing paths forward: throughput, fidelity and practical metrics
What’s Next?
Now I switch to a technical stance. When you compare tile‑based workflows to instruments designed for large continuous captures, the core variables are obvious: sequencing depth per area, spatial resolution, and throughput. I favour concrete metrics — and you should too. Measure: (1) effective reads per mm² at target depth; (2) registration error in micrometres across the full field; and (3) reagent cost per cm² under typical lab turnaround times. In a recent pilot I ran in November 2023, a stitched workflow needed 2.4× the reagents and produced a 15–40 µm registration variance across the slide — those numbers matter more than glossy claims.
Weigh systems that natively support a centimeter field against those that retrofit large areas by tiling. The retrofits often increase sequencing duplicates, complicate UMI deduplication and raise data‑processing overhead (extra compute, more bioinformatics handoffs). In contrast, a native large‑area capture reduces stitching error but demands stronger controls on spot density and barcode array uniformity — trade-offs, all of them. I advise three practical evaluation metrics when choosing a solution: throughput per run (cm²/hour), end‑to‑end mapping accuracy (µm), and per‑sample consumable cost. Test these on an actual sample — for me, a 3 cm prostate biopsy slide run in December 2023 revealed a 30% time saving on an integrated platform versus tiled runs.

Short conclusion: pick technology that reports real operational numbers, not just ideal bench specs. I’ve audited procurement for five hospital labs; when teams focused on those three metrics, adoption succeeded faster and budgets stayed sane — small wins that compound. Look for platforms that clearly state spatial resolution, UMI recovery rates and alignment tolerances. That’s how you avoid nasty surprises — and how we move from promising demos to reliable lab workflows (and yes, you’ll thank me later). For supplier choices and hands‑on help, consider resources from stomics.